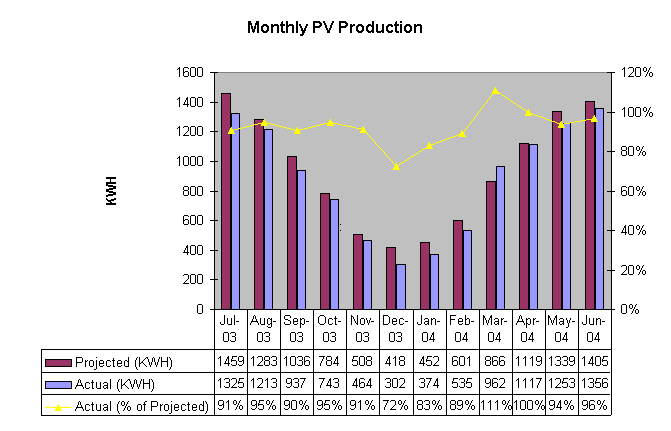
The actual energy produced by the solar panels has been about 7% less than I projected for the final design. We haven't figured out how much of this is caused by shade from trees that grown taller and now cast a shadow on the back solar panels in the late afternoon.

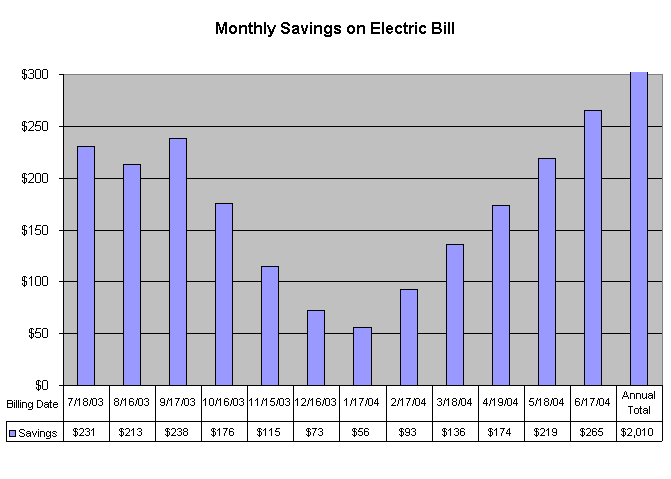
We are saving less per month than expected because we have also reduced our overall electricity usage and so not all of the power from the solar panels are at the top tier rates (of 25 cents per KWH in the summer and 20 cents per KWH in the winter) I projected.
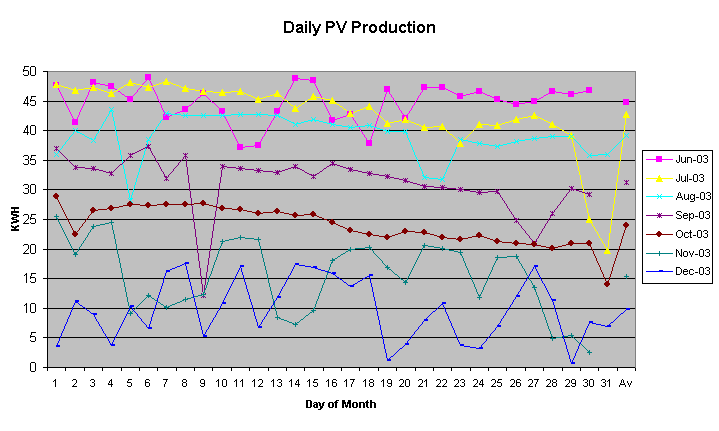
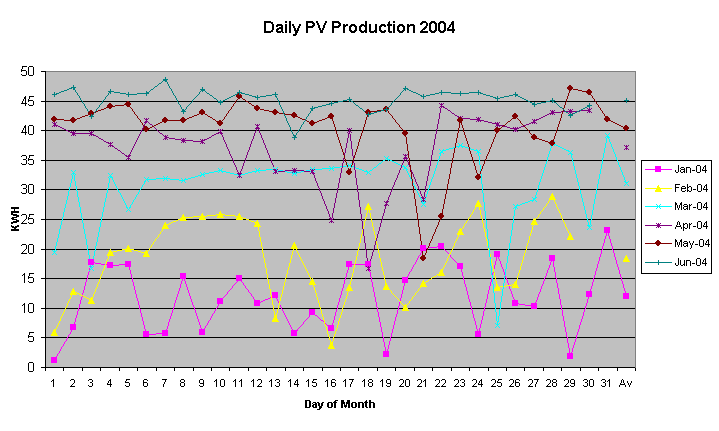
There's lots of variation in production from day to day depending on weather, clouds, temperature, wind and other factors. It was overcast the last days in July. November marked the end of the dry season and the start of the rainy and overcast season.
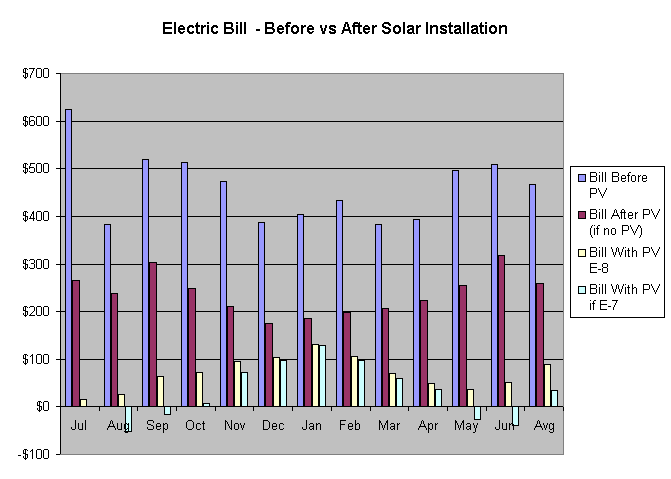
Our power consumption dropped from about 80KWH/day before we installed the solar panels to about 43KWH/day after. That may be due to our decommissioning some old inefficient computers, replacing CRT screens with LCD screens and not replacing some UPSs that died. My projections based on the data from our One Meter is that if we had been on the E-7 rate schedule rather than E-8, we would have saved an additional $500 over the first year. The peak/off-peak data was missing for some months, days or hours due to glitches. Interpolation was used to fill in most of the missing data.
Update: I no longer think we actually used less energy after putting in the solar arrays. A friend who knows about electric meters told me that a lot of the old dial-type meters measure VA, while the new digital meters measure RMS Watts. The difference between VA and Watts could account for the 46% drop in the KWH on our power bill coinciding with the meter being changed.
last changed 2009.09.19
Carolyn Luce